# DataMerger
# Welcome
Dear customer,
Thank you for choosing the DataMerger from movisens. This software solves the complex task of merging and synchronizing data from different sources (like physiological measurement data and experience sampling data) for further statistical analysis.
Please read this manual completely and thoroughly! Within you will find all the relevant instructions for using the software, as well as tips for solving problems.
If you have any further questions, don’t hesitate to call us. It is our pleasure to help you:
Phone: +49 721 381344-0
E-Mail: support@movisens.com
# Scope of application
The DataMerger software tool provides a convenient way to merge and synchronize data from different sources. The software helps to integrate the following movisens software tools and services:
movisens DataAnalyzer (scientific analysis of sensor data)
movisensXS (experience sampling platform)
The following data sources are supported:
Analysed data from all movisens sensors (Move II, ekgMove, edaMove, Move 3, LightMove 3, EcgMove 3, EdaMove 3, and the Move 4, LightMove 4, EcgMove 4, and EdaMove 4)
Mobile sensing data from movisensXS (e.g. location data)
Annotated Geolocation Data from the movisens geocoder
Custom time series data from other sources with compatible date/time format
DataMerger is not a medical device!
# Software Installation
This chapter describes the software installation process and how to update it.
# System Requirements
Before installing the software, please check that your PC fulfils the following system requirements.
A PC with Microsoft Windows 7 or higher, 64 bit
Administrator rights during installation
A minimum of ~200 MBfree space on hard disc
# Installing the software
Please ensure that your PC fulfils the requirements described above.
- Download DataMerger (opens new window).
- Double click the file “movisens_DataMerger_Setup.exe“
- The Installation runs automatically in the background. After successful installation, a shortcut to “movisens DataMerger” appears in the Windows Start Menu.

# Updating the software
You need an internet connection to update the software. Select Windows Start Menu → movisens DataMerger → Updater.
If a new version is available, it will be downloaded and installed automatically after starting the updater software.
# Workflow
In this chapter, you learn how the movisens DataMerger can help simplify data organizational tasks common to most ambulatory assessment / experience sampling studies.
A typical workflow in a study from a data processing perspective consists of the following tasks:
Step 1: Data acquisition using one or more sensors (e.g. movisens EcgMove 3) and/or with experience sampling and/or with mobile sensing (e.g. subjective data and GPS data with movisensXS)
Step 2: Downloading data from sensors (with movisens SensorManager) and/or from the movisensXS platform
Step 3: Optionally checking data for quality and completeness (i.e. sufficient compliance)
Step 4: Data analysis of sensor data using movisens DataAnalyzer
Step 5: Data organization and management
Step 6: Merge and synchronize data from different subjects and different data sources
Step 7: Statistical analysis (SPSS, R, etc.)
DataMerger will help with Step 6 (Merging and synchronizing data). It generates one data file including all the resulting data from all subjects and all data sources perfectly synchronized. You can then use this data file for further statistical analysis (Step7).
This document also describes Step 5 (Data organization and management), because it is a prerequisite for all further steps.
# Data analysis of sensor data
The physiological data recorded with the different types of physiological sensors must be analyzed before merging and synchronization with subjective data from movisensXS can occur.
All the details can be found in the DataAnalyzer User Manual.

When using the DataAnalyzer, make sure you set the same Output Interval for all of your measurements. We suggest using the standard value of 60s. The same value has to be used later in the DataMerger for the interval setting.
# Data organization
To prepare the data from your study for merging, you have to organize the data in a folder structure that matches your study. Here are some examples:
# Example 1: Cross sectional study
For a simple cross sectional study with only one data source (one sensor or only data from movisensXS) create folders for each participant:

The folder for each participant must contain the results folder generated with DataAnalyzer (including the file “results.xlsx”) or the results file downloaded from the movisensXS platform.

The DataMerger generates one file (output.xlsx) containing data from each subject listed in new lines (in the same order as in your folder structure) and with a new column for containing the participant number.
# Example 2: Intervention study
In an intervention study the folder structure may contain two or more groups and two or more measurement points per participant:

The results folder generated with DataAnalyzer (including the file “results.xlsx”) or the results file downloaded from the movisensXS platform needs to be located in the lowest layer of your data structure, e.g. VP1_T1.

The DataMerger generates one file (output.xlsx) containing data from the different groups, subjects and measurement points listed in new lines (in the same order as in your folder structure) and with a new column for each layer of your data structure.
# Example 3: Intervention study with different data sources
When merging data from different sources, the structure should have an additional layer with sub folders for each data source:

The results folder generated with DataAnalyzer (including the file “results.xlsx”) or the results file downloaded from the movisensXS platform within the appropriate folder.

The DataMerger generates one file (output.xlsx) containing data from different groups, subjects and measurement points listed in new lines, and data from different data sources listed in new columns at the end of the table. In addition, a new column for each layer of your data structure is inserted at the beginning.
# Using DataMerger
You can start Data Merger with Windows Start movisens Data Merger Data Merger.
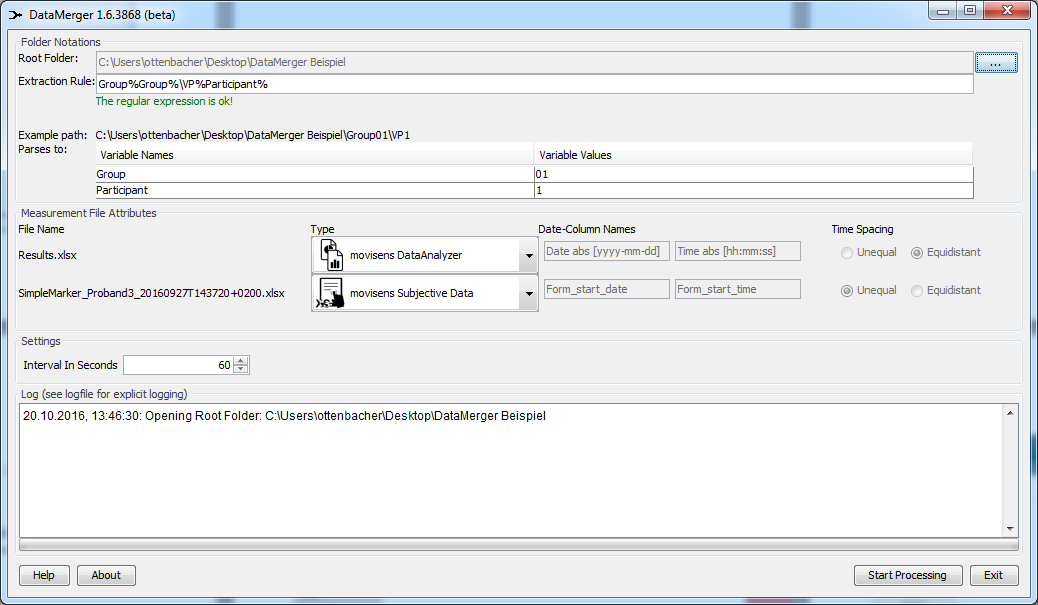
Step 1: Set the root folder by click on the “…”-Button. The root folder should point to the root of your study folder structure that contains all of your data sets (e.g. folder “Example Study” in the previous examples)
Step 2: Enter the extraction rule. This rule extracts the necessary data from your folder structure and shows it in additional columns in the output file. Examples of the extracted data will be shown in the table. Read chapter 5.1 for more details about how to compose the extraction rule.
Step 3: If the extraction rule matches your folder structure, the DataMerger displays the available data sources (sensor data and/or subjective data). Check that all data sources were located properly.
Step 4: Set the output interval for the output. One line of data will be produced for each interval. If you use data processed by DataAnalyzer, the interval setting in DataMerger needs to match the Output Interval setting in DataAnalyzer.
Step 5: Click Start Processing to start the merging process. The final output table appears in the root folder. The filename is output.xlsx.
# Extraction rule
The extraction rule must match the folder structure of your study. It must consist of all folder layers from the root folder up to the folder that holds the data of one measurement point of one participant. Consider the following example:
Here the path from the root folder to the first measurement point of the first participant in the first group is:
\G1\VP1\VP1_T1\
The correct extraction rule to obtain group, participant number and measurement point would be:
G%StudyGroup%/VP%Participant%/VP%dummy%_T%MeasurementPoint%/%DataSource%/*
DataMerger adds the columns StudyGroup, Participant, and MeasurementPoint to the output table and fills in the correct values.
# Examples
# Use movisens XS to set markers in sensor data
This method allows the setting of markers for a single participant or group study. Markers can be set by the participant or by the study personnel.
# Preparation
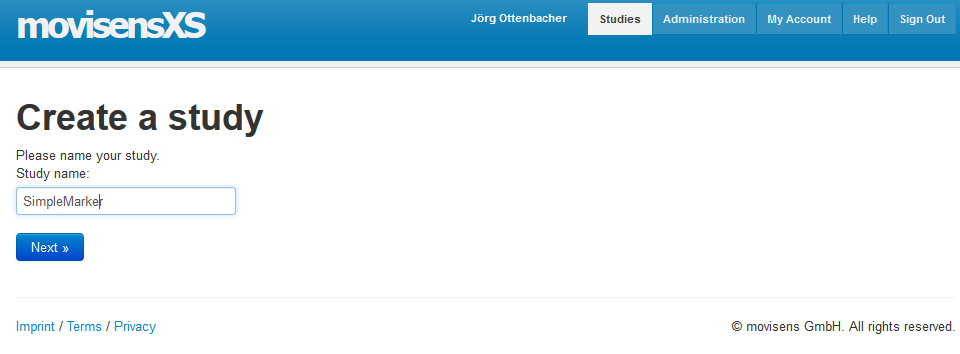
Create a new study in movisens XS
Configure a simple form that displays if you set a marker.
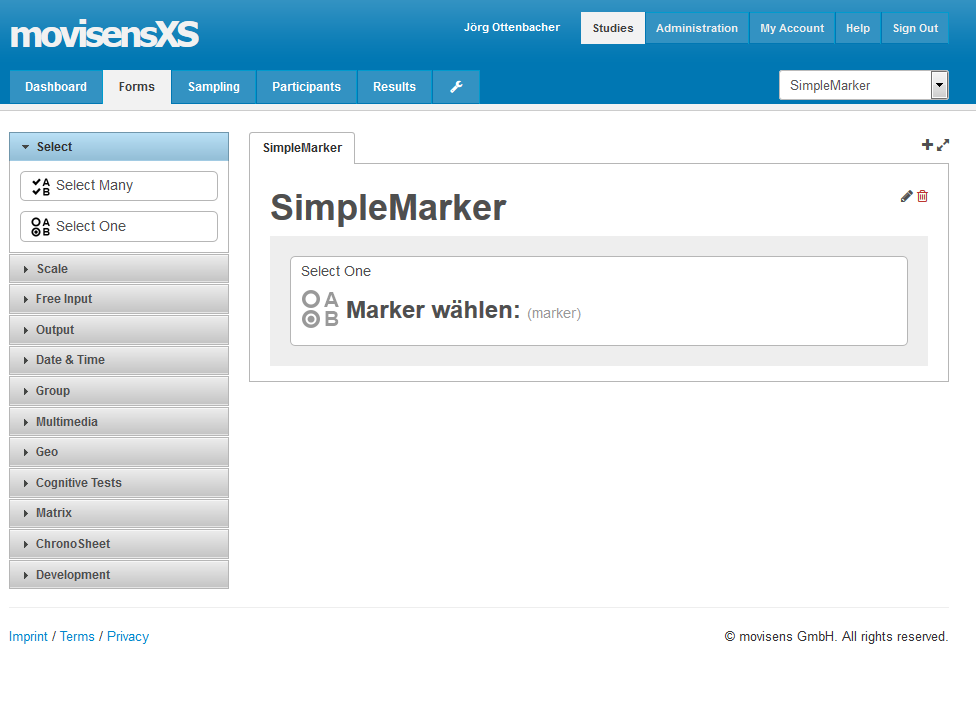
Depending on the information you want to store for each marker you can add items, like a Select One item to describe the marker in more detail.
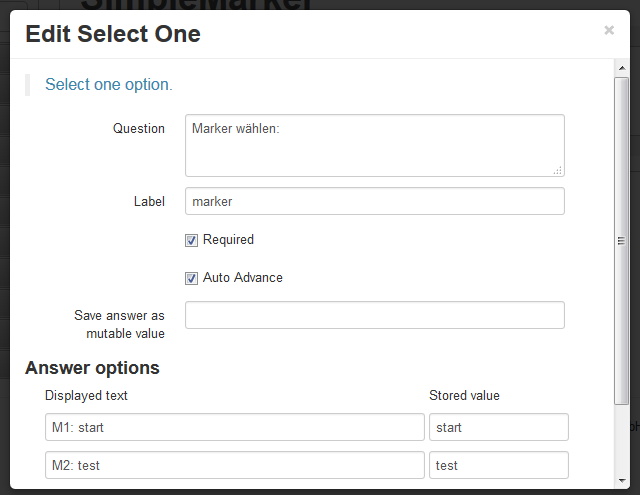
The name of Label (marker) will be shown in a separate column in the final output, containing the text you enter under Stored value.
Next configure a very simple sampling scheme. It will show the form we just defined when a button is pressed.

Edit the Button pressed block and label the button with “Set new marker”:

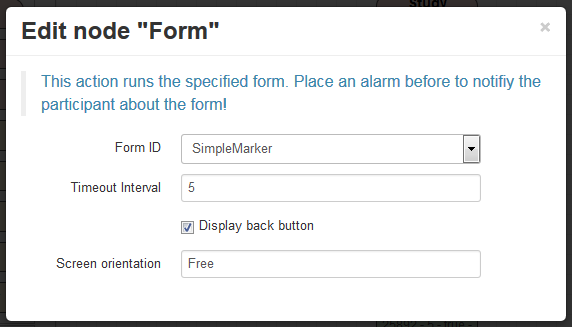
Edit the Form block and select the Name of the form you just created:
Depending on your study size prepare one or more smartphones with the movisensXS App.
# Data Acquisition
For each measurement (single participant or multiple participants) add a new participant in movisensXS and couple a smartphone:

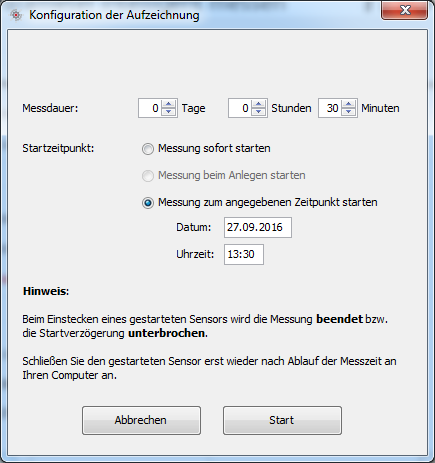
Use movisens SensorManager to start your sensors for data acquisition. For groups we recommend to set the sensors to start recording at the same time:
Make a list that links participants to the participant IDs you entered in the SensorManager and movisensXS. E.g. for a group study:
Group1:
SensorManager: VP1, VP2
movisensXS: ID 2
Conduct your study and set markers or let the participants set the markers:


# Download sensor data
Download the Sensor Data and enter the correct Participant-ID.

# Analyze sensor data
Use DataAnalyzer to analyze your sensor data. Consider using Batch mode to analyze all measurements at once.
# Sort and organize data
Make a directory structure that meets your study needs. For example like this:
\MarkerStudy\
  - \Group01\
      - \VP01\
          - Move3
          - XS
      - \VP02\
          - Move3
          - XS
Move the result data from DataAnalyzer and the results from movisensXS into the according Folders.

# Merge data
Use DataMerger to merge all data together into one result file. Select the base folder of your study. Enter an extraction rule that matches your directory structure. For the above example study you would use:
Group%StudyGroup%/VP%Participant%/%DataSource%/*
This creates the columns StudyGroup and Participant in the output file containing the group and participant numbers extracted from the folder structure.

# Legal Notes
# Copyright
The DataMerger software is protected by copyright. Renting, exchanging, broadcasting, duplication or copies are not permitted.
# Disclaimer
The material in this manual is for informational purposes only. The products it describes are subject to change without prior notice. movisens makes no representations or warranties with respect to this manual or with respect to the products described herein.
movisens shall not be liable for any damages, losses, costs or expenses, direct, indirect or incidental, consequential or special, arising out of, or related to the use of this material or the products described herein.
The DataMerger Software is not a medical device and is not intended to be used for medical purposes.
# Trademarks
Windows is a registered trademark of Microsoft Corporation.
← DataAnalyzer FAQ →