# UnisensViewer
# Introduction
UnisensViewer is a tool for easy handling of sensor data stored in the free and open Unisens data format. (opens new window) With UnisensViewer you can
- Visualize unisens data (e.g. raw sensor data like the ECG wave form as well as analysed data like heart rate variability values that were calculated by DataAnalyzer)
- Display and edit measurement meta information
- Edit measurements, e.g. cut sections
- Set and edit Markers
- Mark artifacts
# Installation
# System Requirements
Before installing the software, please check your PC fulfils the following system requirements:
- Windows PC running Windows 7, 64bit or later
# Installing the software
Step 1: Download the latest installation file from here (opens new window).
Step 2: Double click the file “UnisensViewer_Setup.exe“
- The Installation runs automatically in the background. After successful installation, a shortcut “UnisensViewer” is created in the Windows Start Menu.
# Updating the software
You need an internet connection to make an update. Start UnisensViewer, select "Help" tab in the menu bar and then click "Search for updates". If a new version is available, it can be downloaded and installed.
# Uninstalling the Software
The software can be uninstalled using the Windows Control Panel.
# User Interface of UnisensViewer
The main window UnisensViewer consists of the following areas:
- the menu bar at the top
- the sidebar (with cursor data and expert mode) at the left
- the display area at the right side.
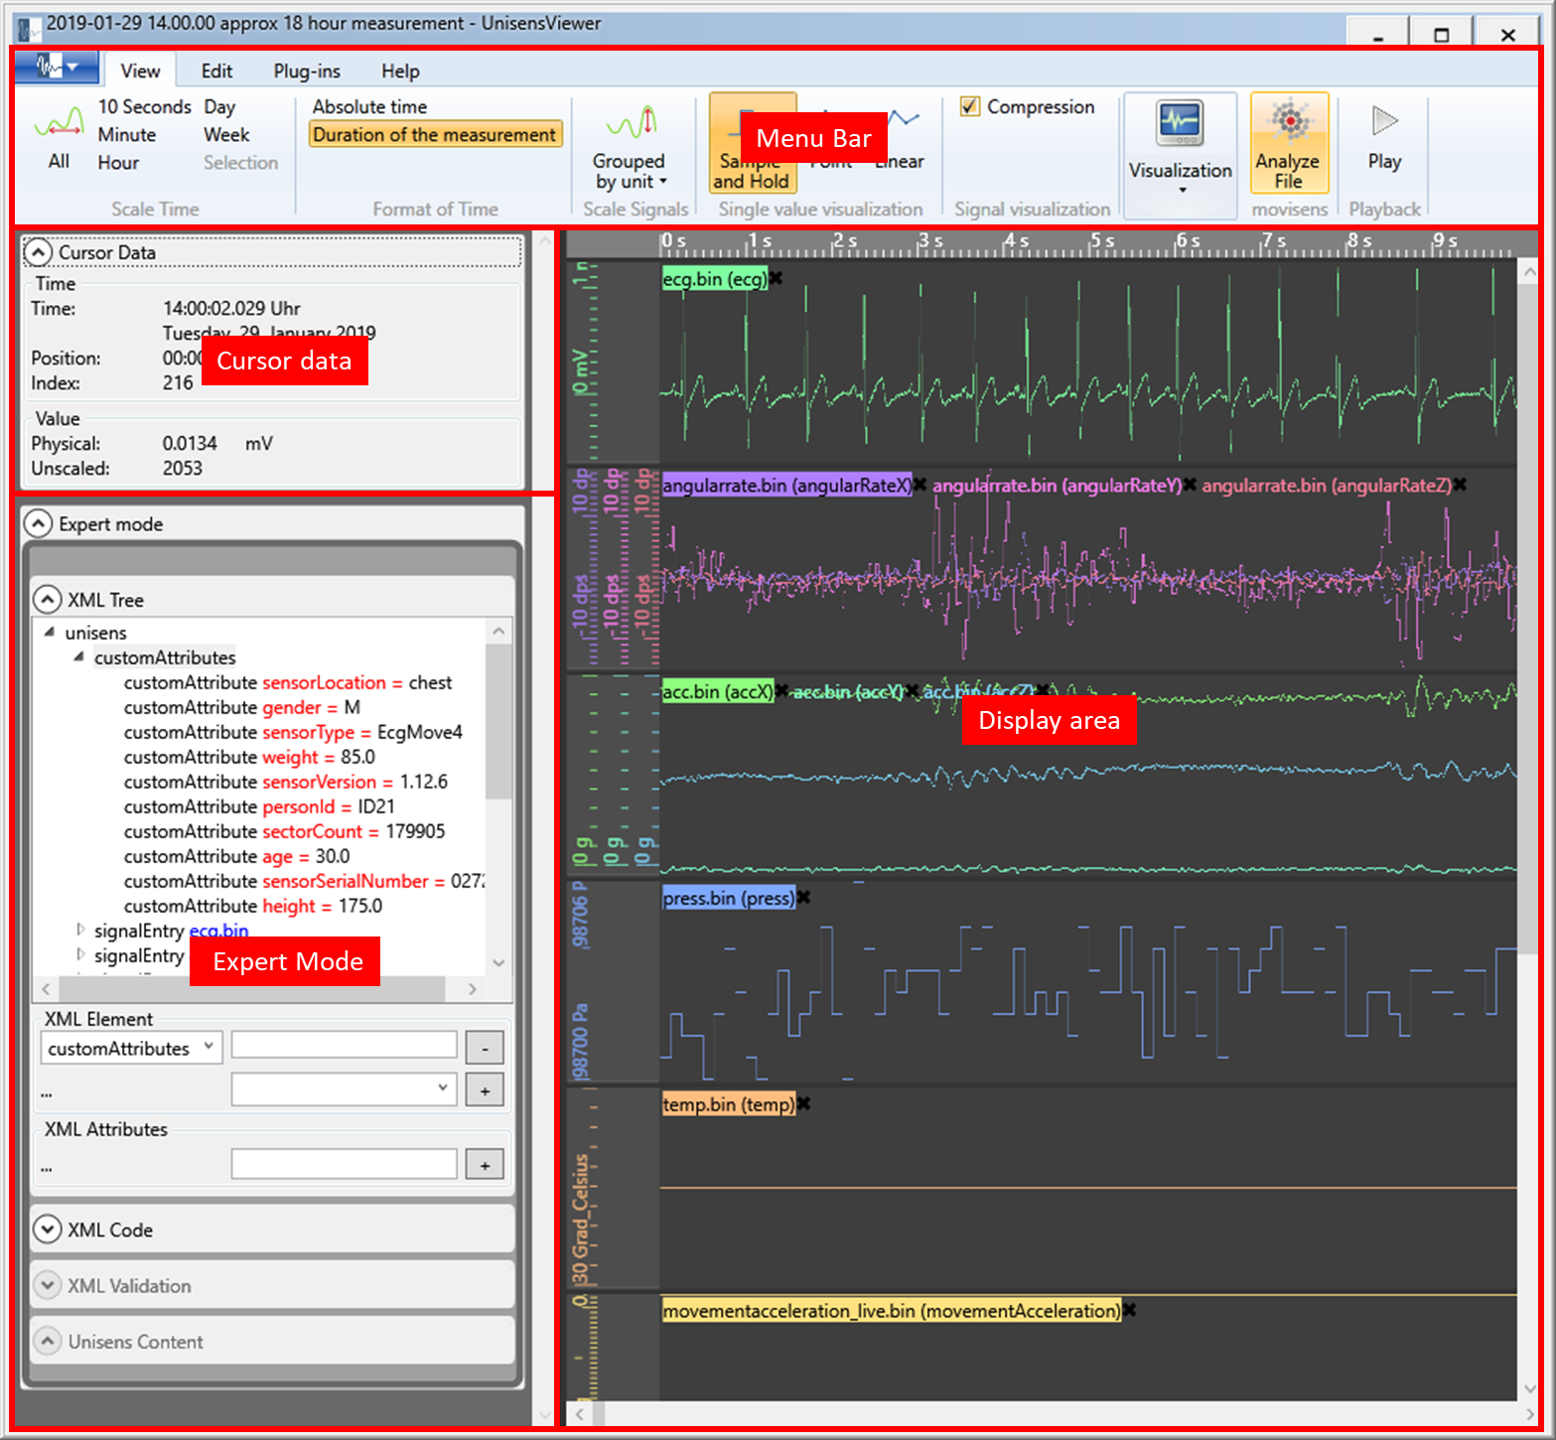
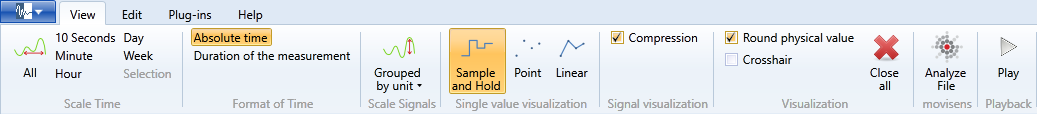
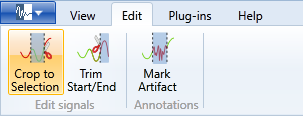
# Menu Bar
The menu bar at the top of the window consists of the following items
- File Button: Open and save data sets and create new data sets
- View Tab: Functions for zooming and other display
- Edit Tab: Function for cutting and croppping
- Plug-ins Tab: Shows function for installed plugins
- Help Tab: Help and Update function

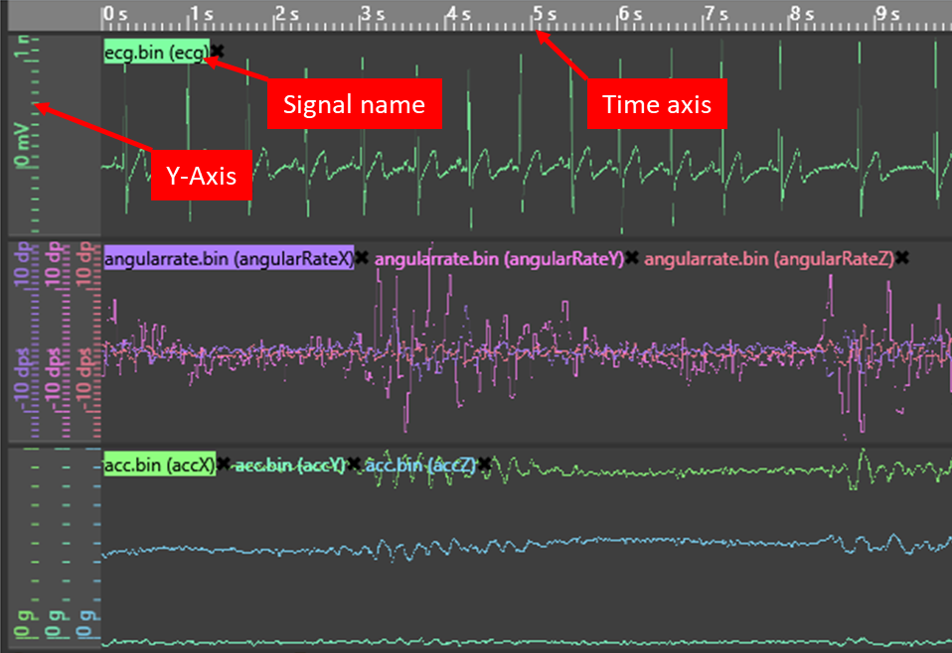
# Display Area
The display area shows signals, measurement values and annotations of the dataset. Mouse gestures can be used for zooming and scrolling. The data displayed can be moved and stacked by drop & drag.
# Sidebar
The width of the sidebar containing the cursor view and the expert mode may be adjusted by dragging it with the mouse.
# Cursor Data
The cursor data area shows information about the current mouse cursor position:
- Absolute Time and Date
- Position (time from the beginning of the measurement)
- Samplenumber (time as numer of sample fron the beginning of the measurement)
- The value of signal (as pyhsical value and the unscaled value representation in the dataset)
If a signal part is marked with the mouse, further information about the marked area appears:
- Beginning and end of the marked area
# Expert Mode
The expert mode area contains all information from unisens.xml headerfile of dataset.
The XML tree displays the meta information from the unisens.xml in a
tree structure. It is possible to browse this tree by klicking at the
elements to fold or unfold the elements. The details of a selected elements are shown below.
The code view (XML Code) shows the area of the unisens.xml which is
marked in the XML tree.
The validation view (XML Validation) shows the information of the
integrated XML validator. If the unisens.xml is not conform to the
associated XSD (XML Schema Document), errors are shown in this view.
# Using UnisensViewer
This section describes the usage of the UnisensViewer. Main features are the support of mouse gestures, drag & drop and the context menu.
# Opening Data Files
Data files can be opened using the open file dialog (File Open... or Ctrl + o) or by dragging and dropping an unisens xml file of a dataset into the XML tree. Subsequently, the data set will appear in the XML tree and the data will be displayed in the display area.
# Displaying Signals, Measured Data and Annotations
To display signals, measured data and annotations, the corresponding entry (SignalEntry, ValuesEntry or EventEntry) can be dragged from the XML tree to the display area. Each entry can only be displayed once in the display area. All elements include a name tag in the format EntryId (ChannelName). The displayed elements can be resorted by drag & drop, stacked on each other, or unstacked. The area which is sensitive for drag & drop is the name tag of the corresponding element.
# Scrolling and Zooming Time
After opening a measurement the time axis is scaled so that 10s fit into the display area. You can now scroll through the measurement by using the horizontal scroll bar at the lower side of the display. Horizontal scrolling (time axis) includes all displayed signals. You can adjust the scaling of the time axis by selecting All, 10 Seconds, Minute, Hour, Day or Week. You can also mark a region in the display area and click
# Horizontal and Vertical Zooming / Scaling
Zooming and scaling of the displayed signals is done by mouse gestures. Horizontal zooming (time axis) includes all displayed signals. Vertical zooming / scaling includes all chosen signals of the current stack. Signals can be chosen by klicking on the name tag.
| Function | Mouse Gesture |
|---|---|
| Horizontal zooming (time axis) | Middle mouse button + vertical mouse gesture |
| Alt + left mouse button + vertical mouse gesture | |
| Vertical zooming (value axis) | Shift + middle mouse button + horizontal mouse gesture |
# Scrolling
Scrolling of signals is done by mouse gestures or by the horizontal scroll bar at the lower side of the display. Horizontal scrolling (time axis) includes all displayed signals. Vertical scrolling refers to all selected signals of the current stack. Signals can be chosen by their name tag.
| Function | Mouse Gesture |
|---|---|
| Horizontal scrolling | middle mouse button + horizontal mouse gesture |
| Alt + left mouse button + horizontal mouse gesture | |
| Vertical scrolling | Ctrl + middle mouse button + vertical mouse gesture |
By pressing Ctrl + Shift at the same time, gestures for vertical scrolling and vertical zooming can be combined.
# Automatic Scaling
Signals can be scaled automatically. For automatic scaling Auto scale has to be selected from the context menu (for the current stack or the selected signals of the current stack). To scale all displayed signals, select View Auto scale from the menu bar and select the preferred scaling function. The following scaling options are supported:
Distinct signals
Signals are scaled such that each signal fully uses the available space.Grouped by files
Signals are grouped before scaling, all files belonging to one entry belong to one group. These signals are scaled around zero with the same factor such that the space at the display is fully used.Grouped by units
Before scaling, signals are grouped, all data files with the same physical dimension belong to the same group. These signals are scaled with the same factor around zero such that the display space is fully used.
# Using the XML Editor
The XML editor which is integrated in the sidebar is responsible to
view, edit or create the files unisens.xml and context.xml.
For a selected element all corresponding details are shown and can be edited:
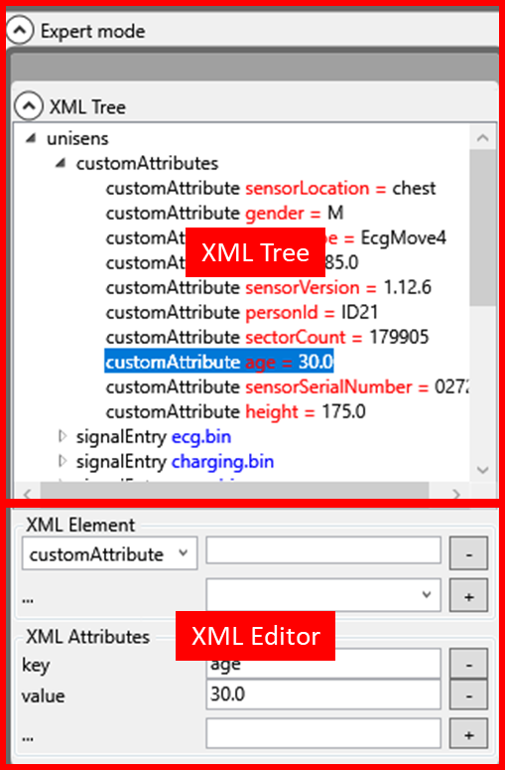
In the above example the age element is selected. You can alter the age by typing in a new value in the value field and pressing Enter.
# Setting a marker
Markers can be used in measurements with the sensors to mark specific events. Markers can be set either during or after the measurement. They can be used to annotate the measurement data to better understand what happened during the measurement. They can also be used to mark certain areas that require special attention when analysing the data.
# How to work with markers
1st possibility: marker can be set during measurement. Therfore the user has to tap two times on the front side of the sensor. The sensor vibrates to confirm the successful setting of a marker.
Marker can be set after measurement within the UnisensViewer
Open the measurement with the UnisensViewer tool. If markers already exist, right-click in the marker window and select 'Set marker'.
If there are no markers, a marker can be set in any window. Note that the sampling frequency (and therefore the precision of the time definition) depends on the signal in which the marker is set.
Recommendation: Set the markers in the signal with the highest sample rate.
A new file will then be created for the markers and a name must be given to it.
Recommendation: The file name should be self-explanatory, e.g. "marker".
Edit marker: Open the file marker.csv with a text editor.
A marker (line) consists of a marker type (e.g. M1) and a marker comment (e.g. Start), separated by a semicolon:
⋅⋅*M1;Start;
The name for the marker type should be kept as short as possible.
In the UnisensViewer only the marker type is displayed over time, in the sidebar also the marker comment of the marker to the left of the mouse pointer.
Analyse marker:The measurement with markers can be evaluated with the DataAnalyzer.
The markers are displayed in the Results.xlsx file.
Marker can also be set during measurement. See how to work with markers (opens new window).
# Licensing
UnisensViewer is a development of FZI Forschungszentrum Informatik and movisens GmbH. UnisensViewer is licensed under the GPL 3.0 license. You can find the project here (opens new window).
← FAQ DataAnalyzer →